Copy Number Calling Workflow

Introduction
We are pleased to add to our human analysis workflow repertoire with wf-cnv. This new workflow enables copy number calling from Oxford Nanopore Technologies sequencing data.
Best practices for human copy number calling are actively being investigated by the ONT applications team, and this workflow puts some of that work into something that can be easily used by our community.
wf-cnv also utilises our new reporting and plotting package ezcharts. This uses python dominate and an apache echart api to allow us to make modern, responsive layouts and plots with relative ease.
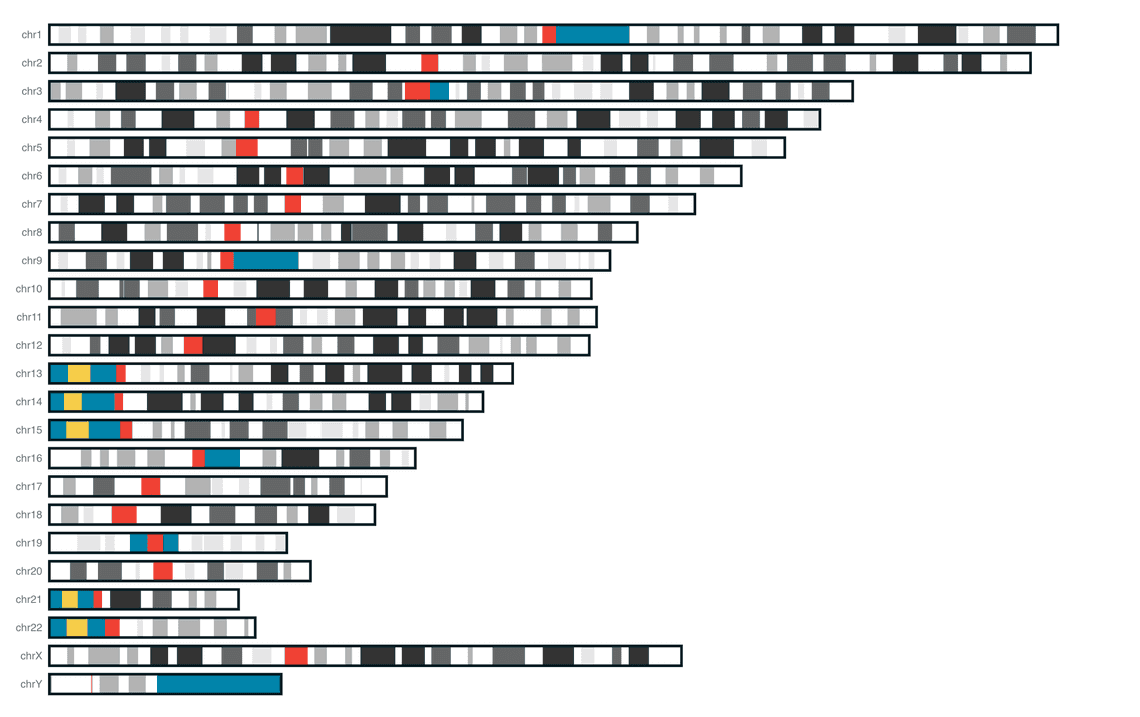
With the release of wf-cnv we also include a new ideogram plotting component for ezcharts.

Pre-requisites
Along with the usual requirements to run our workflows (nextflow & docker) you will need a reference genome in FASTA format, which can be downloaded from UCSC using rsync:
- hg19:
rsync -a -P rsync://hgdownload.soe.ucsc.edu/goldenPath/hg19/bigZips/hg19.fa.gz .
- hg38:
rsync -a -P rsync://hgdownload.soe.ucsc.edu/goldenPath/hg38/bigZips/hg38.fa.gz .
How to run
Example command:
nextflow run epi2me-labs/wf-cnv --fastq <PATH_TO_FASTQS> --fasta <PATH_TO_REFERENCE> --genome <hg19|hg38> --bin_size <BIN_SIZE>
Workflow
CNV calling methods
There are a few different approaches taken by CNV detection algorithms, such as read pair, split read, and assembly-based methods. The algorithm used here, QDNAseq, is based on the commonly-used read depth strategy, which seeks to correlate the copy number of a region with the depth of coverage, so for example, a gain in copy number would have a higher depth than expected. Typically this is achieved by dividing the genome into fixed size bins, and the number of reads within each bin counted and normalised. In addition, it is common for most tools to hold an internal ‘blacklist’ of problematic regions, to improve variant calling.
Workflow details
QDNAseq is an R package which determines the copy number status of bins, the size of which can be tuned by using the --bin_size parameter at run time. Pre-calculated bin annotations are available for hg19 and hg38 for a range of bin sizes (1, 5, 10, 15, 30, 50, 100, 500, and 1000 kbp).
Following alignment of raw reads to a reference, the resulting BAM is used to generate a raw copy number profile using the selected bin size. This is filtered to remove blacklisted bins in problematic genomic regions. The raw profile is further refined by estimating and applying the correction for GC content and mappability, and performing smoothing and normalisation. Segmentation (merging of regions with similar read count to estimate a CNV segment) and CNV calling are carried out using DNAcopy and CGHcall, respectively.
The test samples included were WGA amplified from genomic DNA and sequenced with either rapid or native barcoding for 180mins, and are cell line samples obtained from the NIGMS Human Genetic Cell Repository at the Coriell Institute for Medical Research: NA01920, NA03225, and NA03623. These samples demonstrate that with low coverage and short Nanopore reads an accurate picture of large scale copy number variations can be detected. The read length and bin size affects the results of QDNASeq analysis. In future versions we will provide preset parameters based on detected read length.
| Barcode | Sample Name | Details | Genotypic Sex |
|---|---|---|---|
| barcode01 | NA01920 | Trisomy 21 | XY |
| barcode03 | NA03225 | Chr 7 Deletion | XX |
| barcode05 | NA03623 | Trisomy 18 | XXX |
The FASTQs for three test samples are available here and can be used with the the accompanying sample sheet from here.
Example command with test data:
nextflow run epi2me-labs/wf-cnv --fastq <PATH_TO_DOWNLOADED_FASTQ> --sample_sheet <PATH_TO_DOWNLOADED_SAMPLE_SHEET> --fasta /path/to/hg38.fa.gz --genome hg38 --bin_size 500
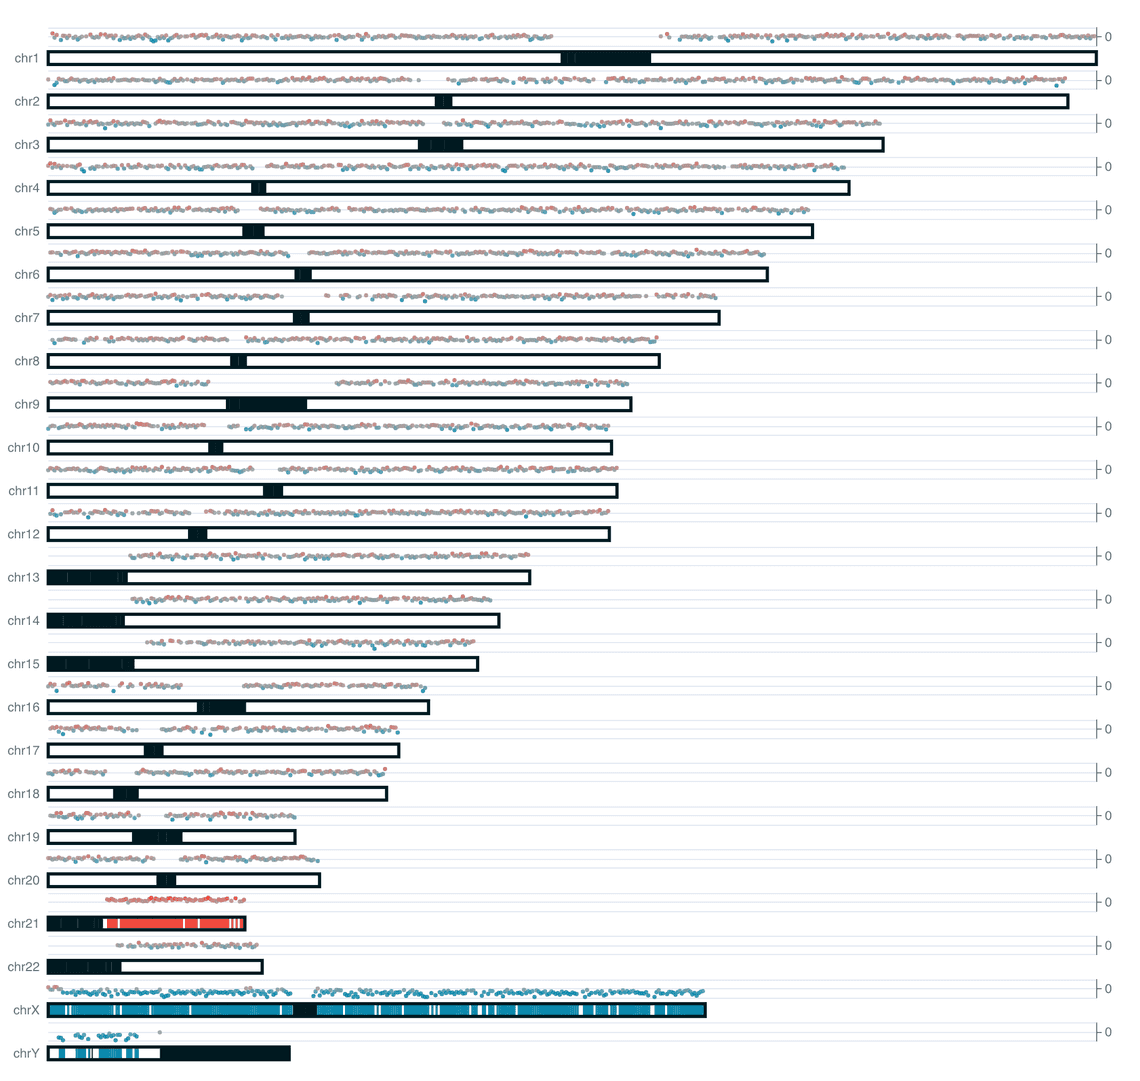
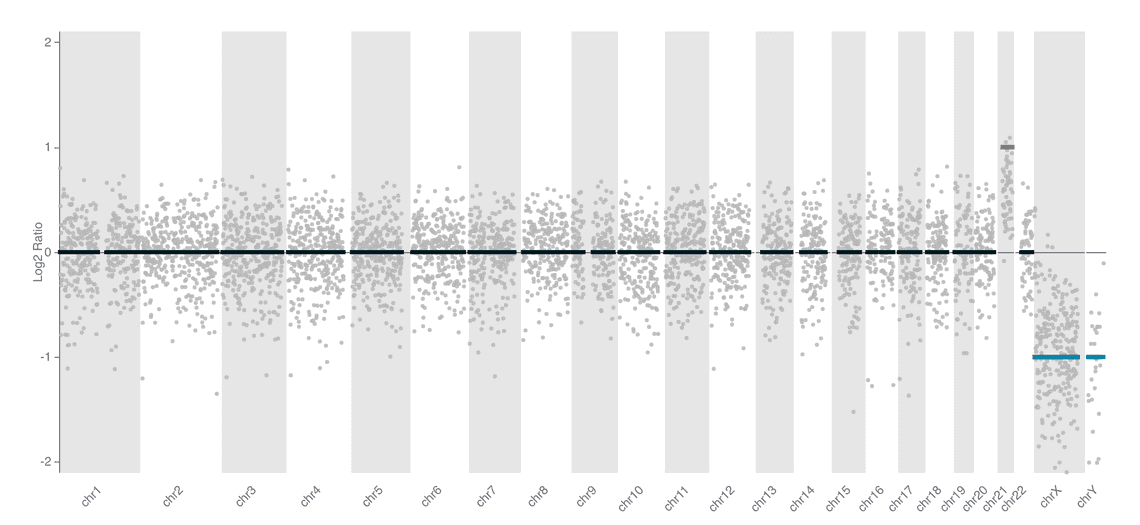
We include two styles of plot on the reports for this workflow. An ideoplot that shows the copy number data from QDNAseq overlaid on a representation of human chromosomes, and a plot of log2 transformed copy number counts per bin.


Output files
The workflow outputs several files per sample:
<SAMPLE_NAME>_wf-cnv-report.html: HTML CNV report containing chromosome copy summary, ideoplot, plot of read counts per bin, links to genes in detected CNVs, and QC data: read length histogram, noise plot (noise as a function of sequence depth) and isobar plot (median read counts per bin shown as a function of GC content and mappability)<SAMPLE_NAME>.stats: Read statsBAM/<SAMPLE_NAME>.bam: Alignment of reads to referenceBAM/<SAMPLE_NAME>.bam.bai: BAM indexqdna_seq/<SAMPLE_NAME>_plots.pdf: QDNAseq-generated plotsqdna_seq/<SAMPLE_NAME>_raw_bins.bed: BED file of raw read counts per binqdna_seq/<SAMPLE_NAME>_bins.bed: BED file of corrected, normalised, and smoothed read counts per binqdna_seq/<SAMPLE_NAME>_calls.vcf: VCF file of CNV calls
Feedback
We welcome feedback on this, and any of our workflows, either in the nanopore community or as GitHub issues on the workflow repository.
Useful Links
- QDNASeq GitHub: https://github.com/ccagc/QDNAseq
- QDNASeq Bioconductor: https://bioconductor.org/packages/release/bioc/html/QDNAseq.html
Reference
- Scheinin I, Sie D, Bengtsson H, van de Wiel MA, Olshen AB, van Thuijl HF, van Essen HF, Eijk PP, Rustenburg F, Meijer GA, Reijneveld JC, Wesseling P, Pinkel D, Albertson DG, Ylstra B. DNA copy number analysis of fresh and formalin-fixed specimens by shallow whole-genome sequencing with identification and exclusion of problematic regions in the genome assembly. Genome Res. 2014 Dec;24(12):2022-32. doi: 10.1101/gr.175141.114. Epub 2014 Sep 18. PMCID.
