A guide to reviewing BAM files

In the world of sequencing data analysis, automation reigns supreme. Standardised workflows, such as those published by the EPI2ME team, efficiently transform raw sequence reads into variant calls and other outputs, a process which is vital for research endevours as well as clinical applications. However, there usually comes a point in many projects where manual review becomes necessary to gain deeper insights. For example in the clinical assessment of sequence variants, particularly in human genomics when evaluating pathogenicity, discerning between authentic variants and those which are artifacts is imperative for accurate prioritisation. This means that when reviewing the results of an analysis workflow, understanding variant calls in the context of corresponding BAM alignments is an important process. In this blog post, we will provide a quick refresher on the file formats involved, discuss some of the different types of variants which can be viewed in the Integrative Genomics Viewer, or IGV, and explore how visualisation can enhance our understanding of genomic variation.
Background
In previous posts we have discussed generating alignments and recently, querying and manipulating VCF files. As a reminder, here is a quick refresher on some of the relevant file formats involved:
- The
SAM(Sequence Alignment/Map) format is a text-based format for storing alignment data, commonly generated by tools such as minimap2 and BWA. It includes details about the alignment of sequencing reads to a reference genome, mapping qualities, and alignment positions. SAM files can be large and can’t be indexed, making them inefficient for large-scale analyses. BAM(Binary Alignment/Map) is the binary version of the SAM format. BAM files store the same alignment information as SAM, but in a compressed binary format, resulting in smaller file sizes and faster data access. Additionally, BAM files can be indexed, giving efficient random access to specific regions. (Occassionally unaligned reads are also stored in BAM, in which case the file is referred to as auBAM,ufor unaligned).CRAM(Compressed Alignment Map) is another alignment format designed to address the storage and access issues of SAM and BAM. Like BAM, CRAM files are highly compressed and support indexing for fast random access. CRAM achieves higher compression ratios than BAM mainly through using reference-based compressions. This makes it especially useful for storing large-scale sequencing data. However it also means the a reference genome file is required for decompression and interpretation, which may not always be available (or convenient to carry around).VCF(Variant Call Format) is a standard text file format used to represent the genetic variation called in a BAM or CRAM file.
In addition, there are other alignment formats such as PAF (Pairwise mApping Format) and MAF (Multiple Alignment Format); BAM files remain the most commonly used in genomics research.
BAM files are not human-friendly due to their binary format, but fortunately there are a number of tools that enable us to extract insights from these files.
Among them is the popular Integrative Genomics Viewer, IGV, which is the software that will be used to navigate alignments in this post.
Other well-known genome browsers are available such as UCSC, Ensembl, and Jbrowse, each with their own advantages.
You may be wondering why we need to view BAM files in this way, when after all, the VCF contains a list of all the variants detected, and important metadata about them. The answer lies in the nuance of variant assessment: while VCFs offer a condensed summary of variants, BAM files hold a wealth of contextual information crucial for distinguishing true variants from artifacts. By loading BAM files into IGV, we can gain access to a dynamic workspace where variants can be viewed in their genomic context along with useful metadata and additional annotation tracks. This visual representation enchances our understanding, revealing details which may not be obvious from a cursory examination of the VCF alone.
Exploring an alignment in IGV
IGV can be run in a browser or is available to download as a desktop application for a range of platforms.
Before you can explore an alignment, it is first necessary to load the correct reference genome.
The default reference genome loaded is human genome build hg38, however it is possible to load alternative versions of the human genome, or indeed the reference of an entirely different organism, by selecting the appropriate option from the Genomes drop-down menu.
You can select a pre-loaded genome, or upload your own reference FASTA file - handy if you work with less commonly studied organisms such as the mighty Axolotl.
Once the appropriate genome is selected, the next step is to load the alignment.
Key points to remember before you load a BAM file:
- The reads in the BAM are aligned to a specific reference genome. If you load the BAM file with a different reference genome selected in IGV, the alignment positions of the reads may not match the co-ordinates of the new genome, which could result in misinterpretation, misaligned visualisations, and missing features, and may cause the application to crash.
- The BAM file should be sorted and indexed before being loaded into IGV. Please refer to our previous post on alignment for more information on how to do this.
- While IGV can read an unsorted BAM, it may not display the reads in the correct order, potentially affecting visualisation and analysis.
Once you are satisfied that your BAM is ready, you can load it into IGV using the File drop-down menu.
As well as BAM files, A number of other file types can be loaded into IGV.
Among the most important file formats supported, there are:
- VCF format, particularly useful if you are trying to understand more about specific variants in your results.
- BED format and its variants, useful to see values in genomic ranges e.g. methylation rates in bedMethyl format, and signal intensity data from experiments such as ChIP-seq, in bedGraph format.
Let’s start with a really simple example.
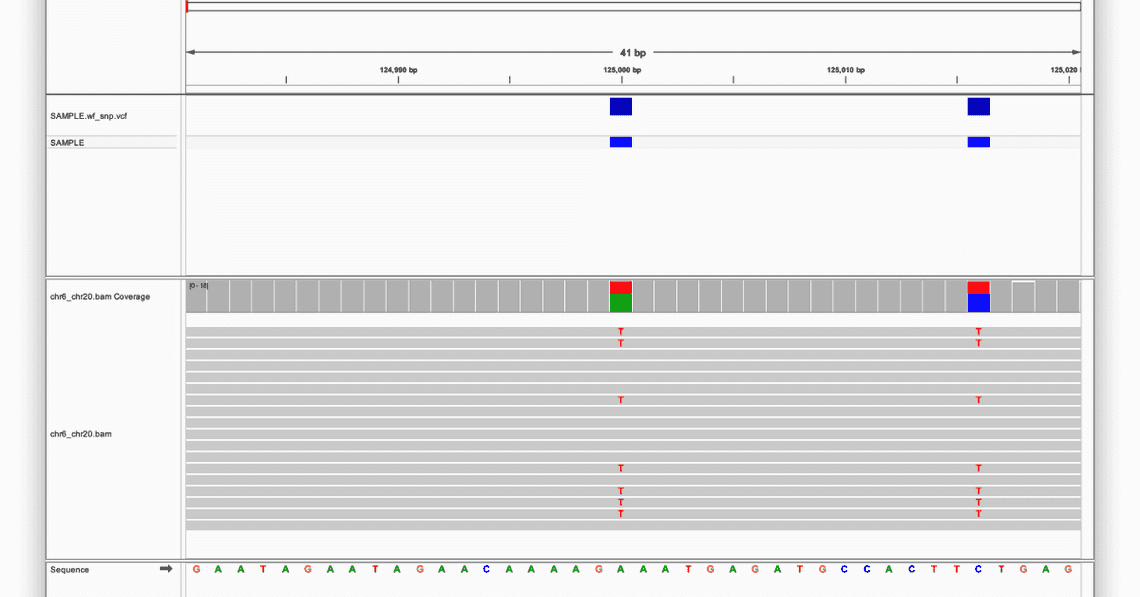
Here we’ve loaded the demo reference FASTA and BAM for the snp sub-workflow of wf-human-variation, along with with the VCF generated by the workflow:

At the top of the screen there are various ways to access positions in the selected reference, either by selecting a chromosome, entering some co-ordinates, and also zooming in and out with the slider at the far right.
At the bottom of the screen is the reference sequence, and in this example there are two positions which are different from the reference: both heterozygous variants, highlighted in the red boxes.
The first is an A to T substitution, and the second is a C to T substitution, and both have been recorded as variants in the VCF, as the blue boxes above each one denote.
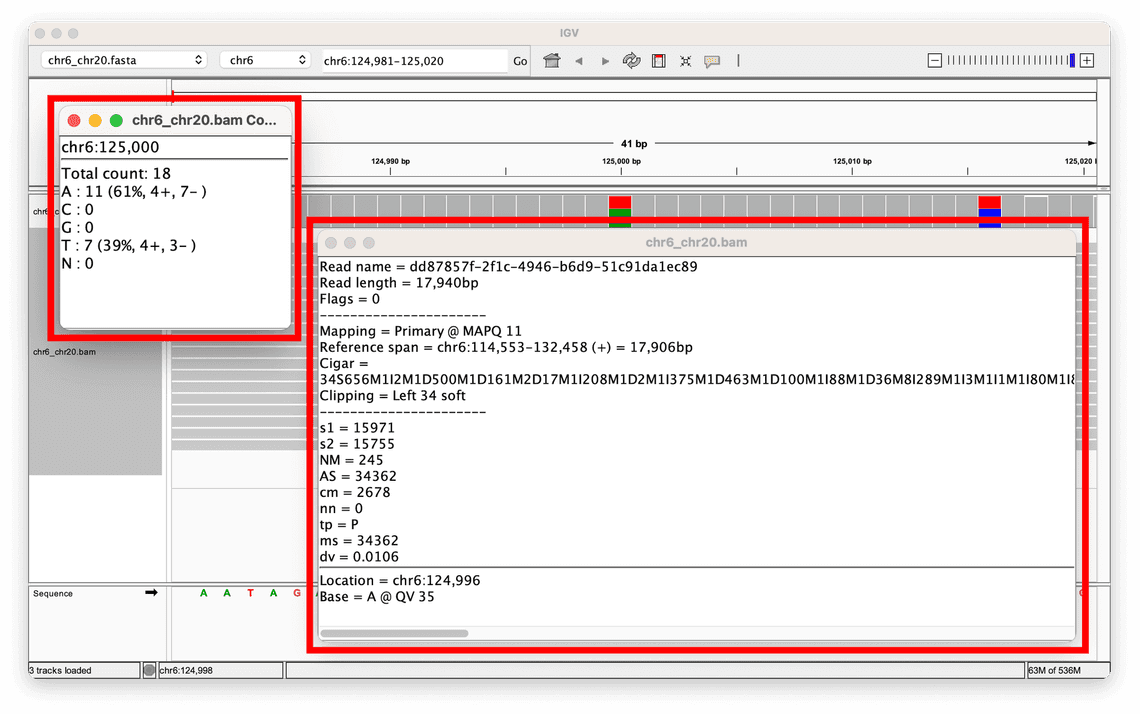
Clicking on the coloured boxes on the chr6_chr20.bam Coverage track will bring up information about the coverage at that position, and the ratio of observed to reference alleles.
It is also possible to view information about individual reads by clicking on them; this will bring up a host of metadata such as read name, length, and mapping quality.
Examples of both of these features can be seen in the image below:

MAPQ scores
One metric that is helpful when assessing whether an alignment supports a variant call made is the mapping quality, or MAPQ score.
This is a score assigned to each read alignment in the BAM.
It represents the confidence or reliability of the alignment of a read to a specific location in the reference genome, with scores ranging from 0 to 255, where higher values indicate a greater confidence in the alignment.
In the toy example given above, the MAPQ scores for the reads supporting the two variants displayed range from 60, all the way down to 1.
If this were a real dataset, it may be worth performing some filtering on the data as the range of relatively low MAPQ scores indicates that there is very little confidence in the alignment of some reads, which could indicate that the variant calls made are also not reliable.
Visualising complex variation
The data generated by sequencing experiments, and especially long-read sequencing from Oxford Nanopore, enables us to discover a bigger range of variant type than ever before.
For example split reads, which are sequence reads which do not align continuously to the reference genome but instead partially align to different regions, indicate potential support for candidate structural variations, or other complex genomic events.
Visualising structural variants such as insertions, deletions, inversions, or translocations, allows us to directly observe the breakpoints, or boundaries, of structural variants.
With long reads we can identify events several thousands of kilobases in size, and so visualising them can be helpful to determine whether they are real or artifacts.
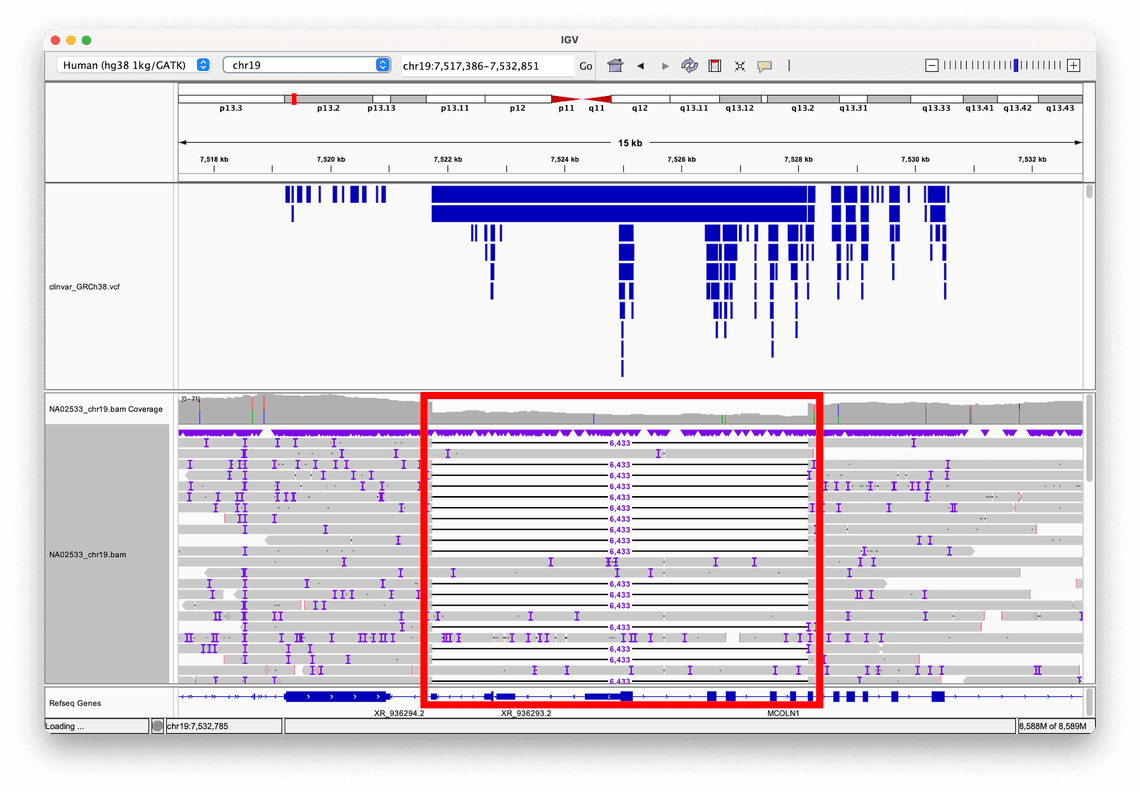
Consider this 6kb deletion a human reference sample from Coriell, NA02533, called by Sniffles2, which is a structural variant caller that is included within wf-human-variation.
By selecting the option to sort alignments by read length, we can clearly see where this large deletion event, highlighted in the red box, has disrupted the normal genomic sequence, resulting in some reads aligning partially to the deleted region, and partially to the flanking sequences on either side of it.
In this example, we have also loaded a VCF of annotations from ClinVar, which is a database of human clinical variation, and are rendered as blue bars in the track above the alignment.
This allows us to see that this particular structural variant is recorded in ClinVar, and gives us access to further information about the variant.

IGV can also be used to colour and group bases to identify other patterns which can be useful for interpretation.
Haplotypes, which are combinations of alleles or variants located on a single chromosome, offer valuable insights into genetic inheritance.
Through the process of phasing, we can ascertain which variants co-occur on the same chromosome, thereby unravelling the parental origin of genetic material within an individual’s genome.
Variant phasing involves determining precisely whether specific genetic variants, such as single nucleotide variants (SNVs) or insertions/deletions (indels), reside on the chromosome inherited from one parent or the other.
Haplotagged reads, such as these generated within wf-human-variation by software such as whatshap and longphase, assign tags that link the reads or contigs to the haplotypes they to which they belong.
Some of our workflows use software which performs this functionality, and the resulting BAM file can give us greater insight when evaluating certain variants.
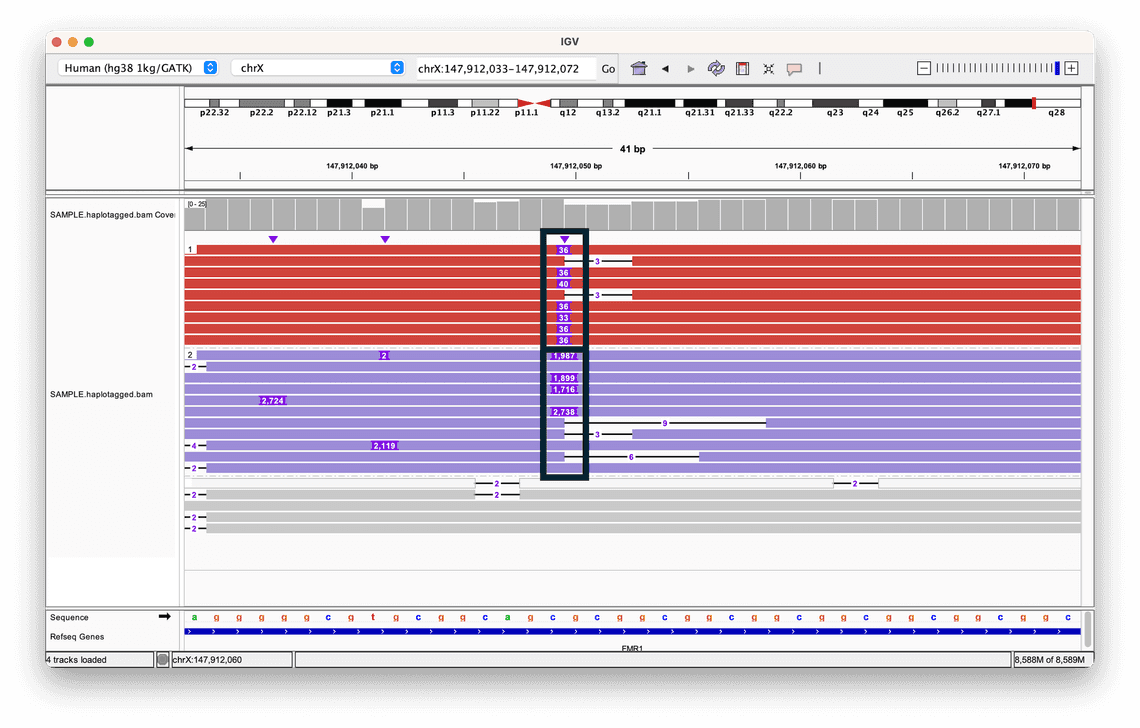
We can use IGV to visualise this, as in the example below:

To visualise the haplotypes, we have coloured and sorted each read based on the value of the HP tag.
This helps us to clearly see the difference in the two alleles: while both contain insertions, the size of the insertion in one allele is much greater than the other, highlighted by the two black boxes.
The grey reads indicate that no haplotype could be assigned.
In fact this is a human Coriell reference sample, NA07063, that harbours a short tandem repeat expansion in the FMR1 gene, and by organising the reads in this way, it is possible to view the inserted sequences in the context of their haplotypes, giving us more context about the variant.
Summary
In this blog post we have looked at the file formats relating to alignment, and how visualising alignments in IGV can be used to help assess whether or not a variant is real, which is a crucial part of the investigation process. We have seen some examples of visualising some more complex variants and changed some basic settings in IGV to produce a more informative visualisation, and we have also loaded other types of data to provide additional annotations to help understand the variants in the BAM file. As a reminder, all EPI2ME workflows produce BAM files which are aligned and sorted, and therefore compatible with IGV. By delving further into BAM files using platforms such as IGV, it’s possible to customise an analysis and add annotation layers, and tailor the analysis to answer specific research questions.
Further information
For more information on using the IGV desktop application, there is extensive documentation available, along with some excellent video tutorials.
